本章主要通过线性模型介绍TensorFlow的一些基本使用流程。
这是几篇与原作不完全相同的教程,转载请说明出处:Gaussic
原作者:Magnus Erik Hvass Pedersen / GitHub / Videos on YouTube
需要导入的包
import tensorflow as tf          # TensorFlow
import matplotlib.pyplot as plt  # matplotlib绘图
import numpy as np               # Numpy
from sklearn.metrics import confusion_matrix    # 混淆矩阵,分析模型误差

# notebook使用
%matplotlib inline
载入数据
TensorFlow在样例教程中已经做了下载并导入MNIST数字手写体识别数据集的实现,可以直接使用。以下代码会将MNIST数据集下载到data/MNIST目录下,将标签保存为one-hot编码。
from tensorflow.examples.tutorials.mnist import input_data
mnist = input_data.read_data_sets('data/MNIST', one_hot=True)
MNIST数据集总共有70000张手写数字图片,数据集被分为训练集、测试集和验证集三部分。
print("数据集大小:")
print('- 训练集:{}'.format(len(data.train.labels)))
print('- 测试集:{}'.format(len(data.test.labels)))
print('- 验证集:{}'.format(len(data.validation.labels)))
数据集大小:
- 训练集:55000
- 测试集:10000
- 验证集:5000
One-hot编码
每一张图的标签使用了one-hot编码保存在numpy矩阵中,而不是原本的类别,这是为了方便神经网络的处理。
print(data.test.labels[:5])
[[ 0.  0.  0.  0.  0.  0.  0.  1.  0.  0.]
 [ 0.  0.  1.  0.  0.  0.  0.  0.  0.  0.]
 [ 0.  1.  0.  0.  0.  0.  0.  0.  0.  0.]
 [ 1.  0.  0.  0.  0.  0.  0.  0.  0.  0.]
 [ 0.  0.  0.  0.  1.  0.  0.  0.  0.  0.]]
在one-hot编码中,只有对应类别的那个位置为1,其余都为0,我们可以使用以下代码将其转换为真实类别:
data.test.cls = np.argmax(data.test.labels, axis=1)
print(data.test.cls[:5])
[7 2 1 0 4]
数据维度
在MNIST数据集中,原始的28*28像素的黑白图片被展平为784维的向量。
print("样本维度:", data.train.images.shape)
print("标签维度:", data.train.labels.shape)
样本维度: (55000, 784)
标签维度: (55000, 10)
为使得网络结构更加清晰,在这里对这些固定维度做如下定义:
img_size = 28                        # 图片的高度和宽度
img_size_flat = img_size * img_size  # 展平为向量的尺寸
img_shape = (img_size, img_size)     # 图片的二维尺寸

num_classes = 10                     # 类别数目
打印部分样例图片
def plot_images(images, cls_true, cls_pred=None):
    """
    绘制图像,输出真实标签与预测标签
    images:   图像(9张)
    cls_true: 真实类别
    cls_pred: 预测类别
    """
    assert len(images) == len(cls_true) == 9   # 保证存在9张图片

    fig, axes = plt.subplots(3, 3)   # 创建3x3个子图的画布
    fig.subplots_adjust(hspace=0.3, wspace=0.3)  # 调整每张图之间的间隔

    for i, ax in enumerate(axes.flat):
        # 绘图,将一维向量变为二维矩阵,黑白二值图像使用 binary
        ax.imshow(images[i].reshape(img_shape), cmap='binary')

        if cls_pred is None:  # 如果未传入预测类别
            xlabel = "True: {0}".format(cls_true[i])
        else:
            xlabel = "True: {0}, Pred: {1}".format(cls_true[i], cls_pred[i])
        ax.set_xlabel(xlabel)

        # 删除坐标信息
        ax.set_xticks([])
        ax.set_yticks([])
# 随机取9张图片
indices = np.arange(len(data.test.cls))
np.random.shuffle(indices)
indices = indices[:9]

images = data.test.images[indices]
cls_true = data.test.cls[indices]

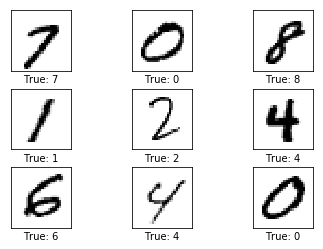
plot_images(images, cls_true)
TensorFlow计算图
TensorFlow使用计算图模型来构建神经网络。其主要流程是先建立好整个网络的计算图模型,然后再导入数据进行计算。
一个TensorFlow计算图包含以下几个部分:
- Placeholder: 占位符,用来读取用户输入与输出;
- Variable: 模型的变量,也称为参数,在计算过程中逐步优化;
- Model: 使用的神经网络模型,也可以使用一些简单的计算;
- Cost Function: 代价函数,也称损失函数,如何计算模型的误差;
- Optimizer: 优化器,使用哪种优化策略来降低损失。
Placeholder占位符
占位符为输入与输出占据位置,这写输入输出一般在不同的轮次都会有所变化。由于TensorFlow先构图再计算,所以需要使用占位符为输入和输出预留位置。
x = tf.placeholder(tf.float32, shape=[None, img_size_flat])
y_true = tf.placeholder(tf.float32, shape=[None, num_classes])
y_true_cls = tf.placeholder(tf.int64, shape=[None])
在上面的代码中,None表示一次输入多少数据,这一般跟样本的数量和每个批次的数据量batch_size有关。
Variable变量
变量是模型的参数,这些参数在模型的计算过程中会被逐步的优化,以使得模型在训练集上有更好的表现。例如在本文的线性模型中,参数有两个:
$$
y = Wx+b
$$
其中的$W$就是模型的权重,$b$就是模型的偏移量,这两个变量会在计算过程中被优化。
weights = tf.Variable(tf.zeros([img_size_flat, num_classes]))
biases = tf.Variable(tf.zeros([num_classes]))
需要注意的是,输入的是784维的向量,输出的标签是10维的向量,$W$是输入到输出的映射,因此它的维度为[784, 10],而$b$是偏移量,因此维度为[10]。我们首先将它们初始化为0,TensorFlow会自动进行调整。
Model模型
上面给出了整个模型的公式,因此实现起来非常简单:
logits = tf.matmul(x, weights) + biases
tf.matmul表示矩阵乘法。上式返回的结果是一个 [None, num_classes] 的矩阵。logits是TensorFlow常用术语,这里不去考虑。这个结果离真实的分类还有一定的距离,我们需要使用一个softmax来对其归一化,以使得它的和为1。Softmax函数类似于计算了每一个维度的概率,其中最大的那个概率即对应它的类别。
y_pred = tf.nn.softmax(logits)
y_pred_cls = tf.argmax(y_pred, axis=1)
y_pred_cls 的计算与之前使用Numpy计算类别的方式相似,说明TensorFlow的许多操作都和Numpy是相通的。不同的是Numpy的计算是实时的,而TensorFlow只有在运行计算图时才会返回结果。
Cost Function代价函数
代价函数用来评估模型的错误率。模型的损失越高,说明离真实结果的偏差越大,需要尽可能的减小这个损失,以使得模型尽可能的准确。
代价函数存在多种的形式,比较常用的是平方误差和交叉熵。在这里使用更常用的交叉熵,有关交叉熵的细节请另外查阅资料。
cross_entropy = tf.nn.softmax_cross_entropy_with_logits(logits=logits, labels=y_true)
cost = tf.reduce_mean(cross_entropy)    # 交叉熵平均值即代价
需要注意的是,传入的是计算softmx之前的logits,而非y_pred,这其中的原因是softmax的计算十分耗时,处于速度的考虑,TensorFlow在实现中直接使用logits,然后在tf.nn.softmax_cross_entropy_with_logits内部使用更高效的方法计算交叉熵,具体的原理仍然是一样的。
在计算完总的交叉熵是,其均值即为代价。
Optimization优化
现在我们已经有了代价函数的度量方法,接下来就需要使用优化器来优化这个代价函数。常用的做法是使用提督下降将来传播误差,然后在更新权重。TensorFlow提供了多种计算梯度的优化器,如果在一个优化器的效果不明显时,可以尝试使用另一个优化器。这里使用基本的GradientDescentOptimizer,学习率为0.5,学习率越低收敛越快,学习率过高可能会导致不收敛。
optimizer = tf.train.GradientDescentOptimizer(learning_rate=0.5).minimize(cost)
性能度量
一般来说,以上的代码就已经完成了模型的构建。但是为了评估模型的性能,还需要一些其他的代码。最直观的是模型的准确率。
correct_prediction = tf.equal(y_pred_cls, y_true_cls)  # 判断相等的元素
accuracy = tf.reduce_mean(tf.cast(correct_prediction, tf.float32))  # 计算准确率
运行TensorFlow计算图
创建Session以及变量初始化
TensorFlow计算图运行在一个session中,计算之前需要先创建这个session,并初始化其中的一些变量(w 和 b),TensorFlow使用session.run()来运行计算图。
session = tf.Session()   # 创建session
session.run(tf.global_variables_initializer())   # 变量初始化
执行优化的帮助函数
在训练集中有55000张图片,如果在每一轮迭代过程中都使用全部的图像作为输入的话,计算时间太长。因此使用小批量的随即梯度下降方法来执行每一次优化。梯度下降过程会自动的优化权重$W$和偏置$b$。
batch_size = 100   # 每一轮的数据量
def optimize(num_iterations):
    for i in range(num_iterations):   # 迭代轮数
        # TensorFlow自己实现了取MNIST下一个批次的操作,这里直接使用,不必深究
        x_batch, y_true_batch = data.train.next_batch(batch_size)

        # 把这批数据放在要喂入模型的dict里面
        feed_dict_train = {x: x_batch, y_true: y_true_batch}

        # 运行优化器,喂入数据
        session.run(optimizer, feed_dict=feed_dict_train)
评估性能的帮助函数
现在需要评估模型在测试数据上的性能,需要将测试数据整个喂入模型中:
feed_dict_test = {x: data.test.images,
                  y_true: data.test.labels,
                  y_true_cls: data.test.cls}
输出准确率:
def print_accuracy():
    # 运行accuracy来计算acc
    acc = session.run(accuracy, feed_dict=feed_dict_test)
    print("测试集准确率: {0:.1%}".format(acc))   # 保留1位小数
输出混淆矩阵:
def print_confusion_matrix():
    cls_true = data.test.cls   # 真实类别
    # 运行y_pred_cls计算出的真实类别
    cls_pred = session.run(y_pred_cls, feed_dict=feed_dict_test)

    # 使用scikit-learn的confusion_matrix来计算混淆矩阵
    cm = confusion_matrix(y_true=cls_true, y_pred=cls_pred)

    # 打印混淆矩阵
    print(cm)

    # 将混淆矩阵输出为图像
    plt.imshow(cm, interpolation='nearest', cmap=plt.cm.Blues)

    # 调整图像
    plt.tight_layout()
    plt.colorbar()
    tick_marks = np.arange(num_classes)
    plt.xticks(tick_marks, range(num_classes))
    plt.yticks(tick_marks, range(num_classes))
    plt.xlabel('Predicted')
    plt.ylabel('True')
输出部分错误样例
def plot_example_errors():
    # 运行计算图,得到争取情况和预测结果
    correct, cls_pred = session.run([correct_prediction, y_pred_cls],
                                    feed_dict=feed_dict_test)
    # 计算错误情况
    incorrect = (correct == False)
    images = data.test.images[incorrect]
    cls_pred = cls_pred[incorrect]
    cls_true = data.test.cls[incorrect]

    # 随机挑选9个
    indices = np.arange(len(images))
    np.random.shuffle(indices)
    indices = indices[:9]

    plot_images(images[indices], cls_true[indices], cls_pred[indices])
优化前的性能
准确率:
print_accuracy()
输出:
测试集准确率: 9.8%
在未进行训练是,测试集的准确率为9.8%,因为$W$和$b$全都被初始化为0,因此所有的预测结果均为0。
部分错误样例:
plot_example_errors()
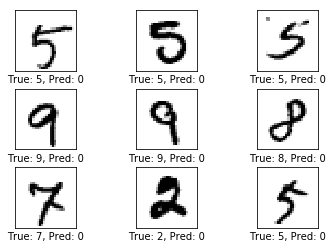
这也证明了上面的说法。
一轮迭代后的性能
optimize(num_iterations=1)
print_accuracy()
测试集准确率: 26.7%
尝试一轮迭代后,准确率提升到了26.7%。
plot_example_errors()
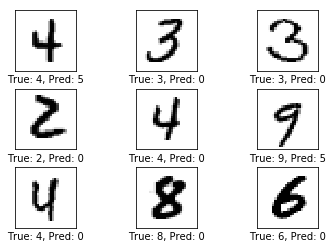
预测结果也有了一定的变化。
最重要的是各个类别的权重情况:
plot_weights()
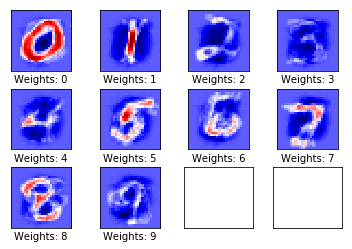
在上图中,蓝色部分的权重为负数,红色部分的权重为正数,这些权重可以看作图片的过滤器。可以看到,模型的权重偏向于数字所在的位置。对于0和1,由于数字比较简单,模型可以很好的识别,而对于其他的数字,模型在识别上有一定的难度,需要更多次的优化。
10轮迭代后的性能
optimize(num_iterations=9)   # 之前已经做过一轮
print_accuracy()
测试集准确率: 81.0%
测试集的准确率达到了81.0%,这是一个非常大的进步。再看看部分的错误样例:
plot_example_errors()
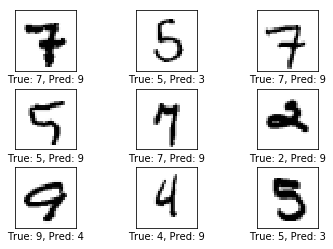
可以发现,图片的预测结果和真实类别存在一定的相似之处。例如4和9,5和3,模型暂时还无法作出准确的判断。
接下来再看看权重的情况:
plot_weights()
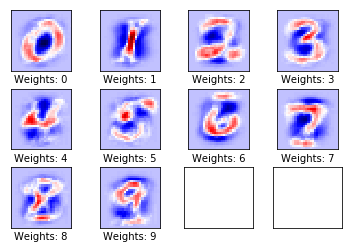
我们发现,图像的红色区域变得更加明显,它们是类别中所有图像的共有属性。对于部分类别(如4,5,9)还存在一定的提升空间。
100轮迭代后的性能
optimize(num_iterations=990)   # 之前已经做过10轮
print_accuracy()
测试集准确率: 91.9%
这个结果已经非常好了。再来看看一些分错的样本:
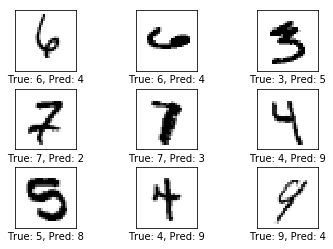
多尝试几次就会发现,部分的样本是在太过抽象,4和6有时候甚至连人都很难分清。因而这样的一个结果应该合情合理。
再来看一下权重:
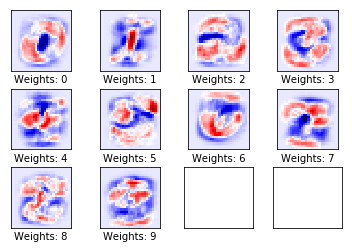
由于训练集的变化多端,为了覆盖多种变化,各类的权重变得有些宽泛,但是焦点仍然在类别中图像的共同之处。
我们再来看看混淆矩阵的情况:
print_confusion_matrix()
[[ 957    0    1    2    0    4   12    2    2    0]
 [   0 1108    2    2    0    3    4    1   15    0]
 [   6    7  922   20    5    3   19   11   32    7]
 [   3    0   16  938    0   21    4    9   13    6]
 [   2    1    6    3  897    1   22    2   10   38]
 [   9    3    6   50    7  762   19    5   24    7]
 [   9    3    3    2    6   12  921    1    1    0]
 [   2   12   24   10    6    2    0  933    2   37]
 [   7    6    7   38    9   32   16    8  844    7]
 [  10    6    1   13   34    8    1   14    9  913]]
对角线上为分类正确的情况,其他为一个类分成其他类的情况。将这个矩阵图像化:
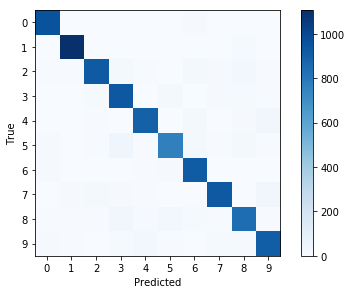
可以发现,大部分的分类均正确,少部分的淡蓝色区域说明存在一定的误分类情况。
在运行完整个计算图后,需要将它关闭,否则将一直占用资源:
session.close()
